Transformative Solutions
Empowering organizations with data-driven strategies for operational excellence and innovation.
Finance and Accounting
Implementing Financial Analisys, Control and Budgeting with QuickBooks Online ProAdvisor so that you may be able to measure your profitability and may be able to attend your financial to IRS.
Strategic Growth
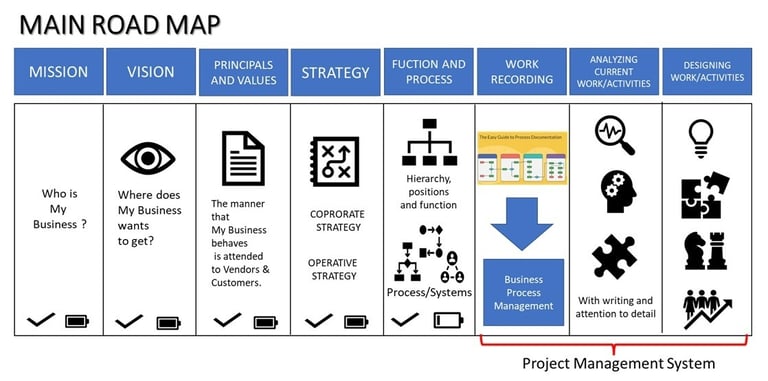
Business Strategy which could be Corporative or Operative
Operations and Marketing
Implementing testing tools since Operational Reseach to document your process and procedures. Analyzing your brand, product and services and selling forces.
Transformational Solutions
Empowering organizations through strategies and insights.


Operational Efficiency
Streamlining processes for enhanced productivity and performance.


Strategic Growth
Driving innovation and scalability for future success.


Human Insight
Leveraging insights to foster resilient organizational cultures.
Tailored Solutions
Custom strategies that unlock performance across industries.
→
→
→
→
BOOKKEEPING SERVICES
Catch up and/or Clean up:
Catch up: Building the books from scratch for a time period that was ignored.
Typical Triggers:
• No transactions entered for months
• Starting fresh with no prior bookkeeping system
• Preparing for tax filing or funding with no recent data
Workflow Highlights:
• Gather historical bank/credit card statements
• Enter all income and expenses
• Reconcile accounts month-by-month
• Create a complete financial history
Clean Up: Diagnosing and repairing a flawed bookkeeping system.
Typical Triggers:
• Duplicate or miscategorized transactions
• Bank balances don’t match statements
• Reports don’t make sense
• Inherited messy QuickBooks file
Workflow Highlights:
• Audit and reclassify transactions
• Fix reconciliations and clear old invoices
• Correct structural issues (chart of accounts, opening balances)
• Ensure reports reflect reality
Basic Start:
Categorize your transactions for your P&L
Reconcile your accounts
Categorize your transactions for your P&L
Reconcile your accounts
Manage your Financial Statements: Profit & Loss, Balance Sheet, Cash Flow
Monthly business consultation based on your business performance to enable growth.
Essentials Operations:


Transform
Guiding organizations through strategy, finance/accounting and operations.
Insights
Growth
moises.ortiz@bepsolutionsus.com
+1-442-453-4652
© 2025. All rights reserved.